How to Use Pivot Tables to Create a Dynamic Balance Sheet in Excel
Although nearly every finance professional has heard of PivotTables, few utilize them effectively to build dynamic balance sheets in Excel.
Most professionals typically copy trial-balance data into static Excel templates, creating a neatly formatted summary. While this method is suitable for high-level reporting such as board packs, forecasts, and presentations, it lacks flexibility when analyzing detailed account movements, period-over-period fluctuations, or investigating anomalies.
A well-designed financial-statement PivotTable fills this gap. Spend a bit of time up front, and you’ll have an audit-ready PivotTable accounting report that also serves as a live investigative dashboard—slice by period or entity, spot trends, and drill straight from headline totals down to account that moved the number. It’s a concise, powerful extension to your existing workflow.
To help you get started quickly, I’ve prepared a sample Excel file with source data and a finished PivotTable that you can download and explore as you follow this guide.
What is a PivotTable and Why Should You Use It?
A PivotTable is Excel's powerful data analysis tool, allowing you to:
Summarize thousands of transactions into meaningful categories
Compare periods side-by-side with drag-and-drop simplicity
Drill down from high-level totals to individual line items
Filter by entity, department, or any other dimension instantly
Key Benefits for Financial Reporting
Speed: Create comprehensive reports in minutes, not hours
Flexibility: Instantly reorganize data without formulas
Accuracy: Eliminate manual copy-paste errors
Auditability: Trace every number back to source data
Exampe of a Balance Sheet PivotTable
The image below shows a balance sheet built as an Excel PivotTable. Notice how the PivotTable's compact layout keeps the report clean while allowing detailed account information to be expanded on demand:
Expand or collapse account categories with a single click
See the exact details driving each total
Use slicers for rapid filtering by Entity, Date, or Department
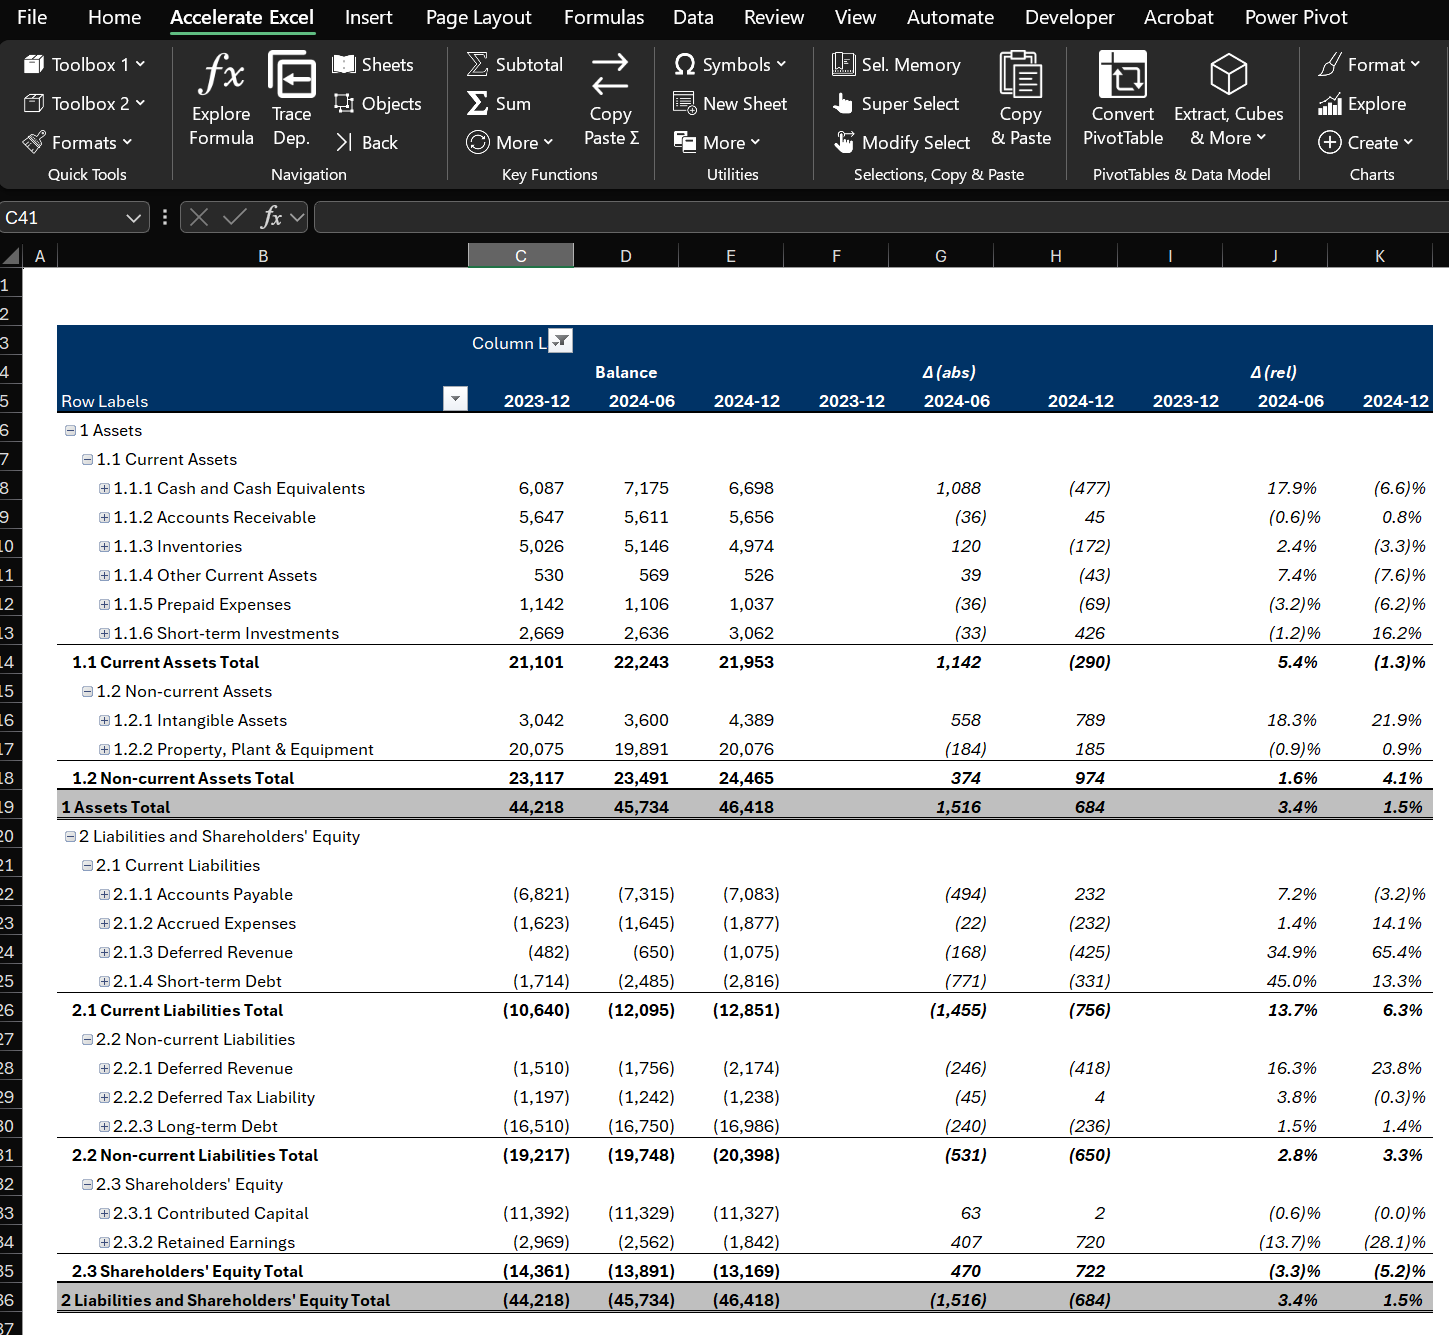
Exhibit 1a. PivotTable Balance Sheet (Compact Layout) with Collapsed Details
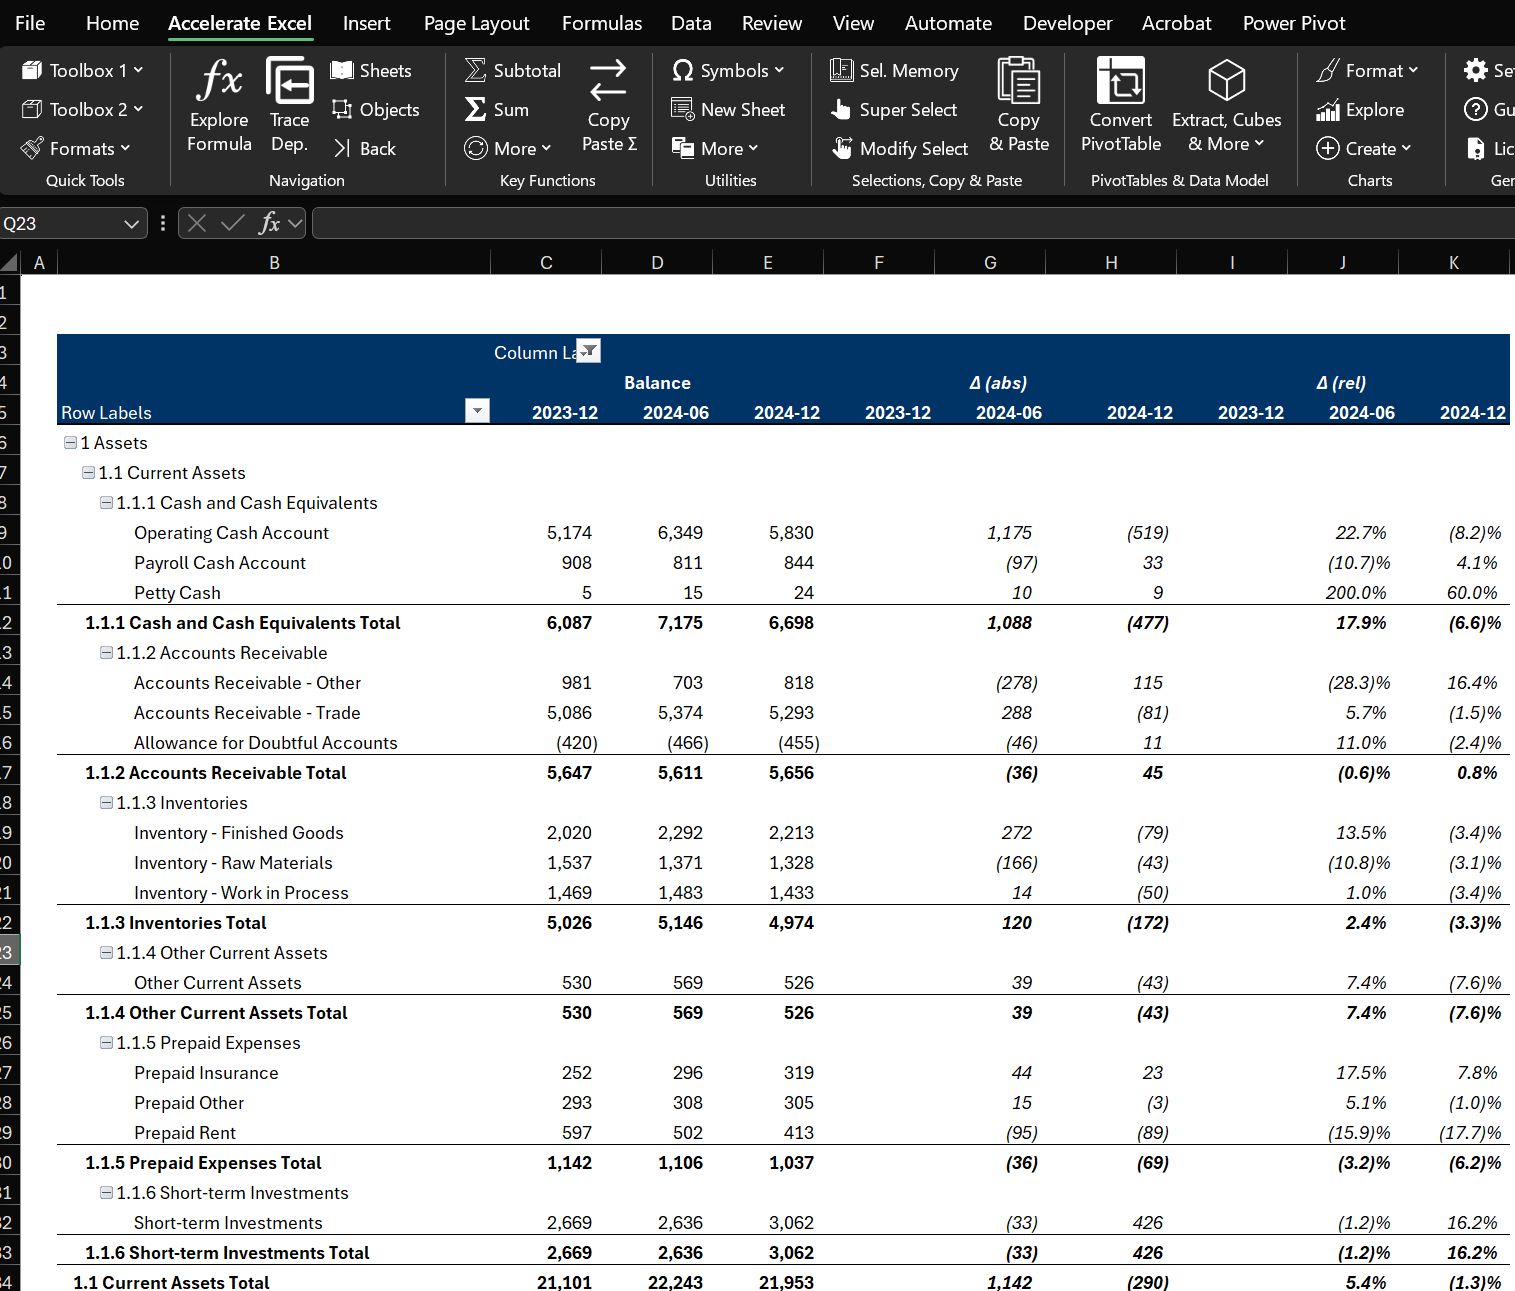
Exhibit 1b. PivotTable Balance Sheet (Compact Layout) with Expanded Details
How to Create a Balance Sheet PivotTable?
Step 1: Data Preparation – Structuring Your Data
Your source data must meet these essential criteria:
Single Column of Values: All amounts must be listed in one dedicated column
Descriptive Attributes: Include multiple columns for context (Account, Entity, Period, Department)
Hierarchy Categories: Assign each amount to proper categories (Assets, Liabilities, Equity) to enable automatic subtotal calculations. Pro tip: Create an account hierarchy mapping table and link it to your source data using VLOOKUP or INDEX-MATCH formulas
Consistent Signage: Ensure assets (debits) show as positive and liabilities/equity (credits) as negative. Use a simple formula to adjust signage based on account type if needed
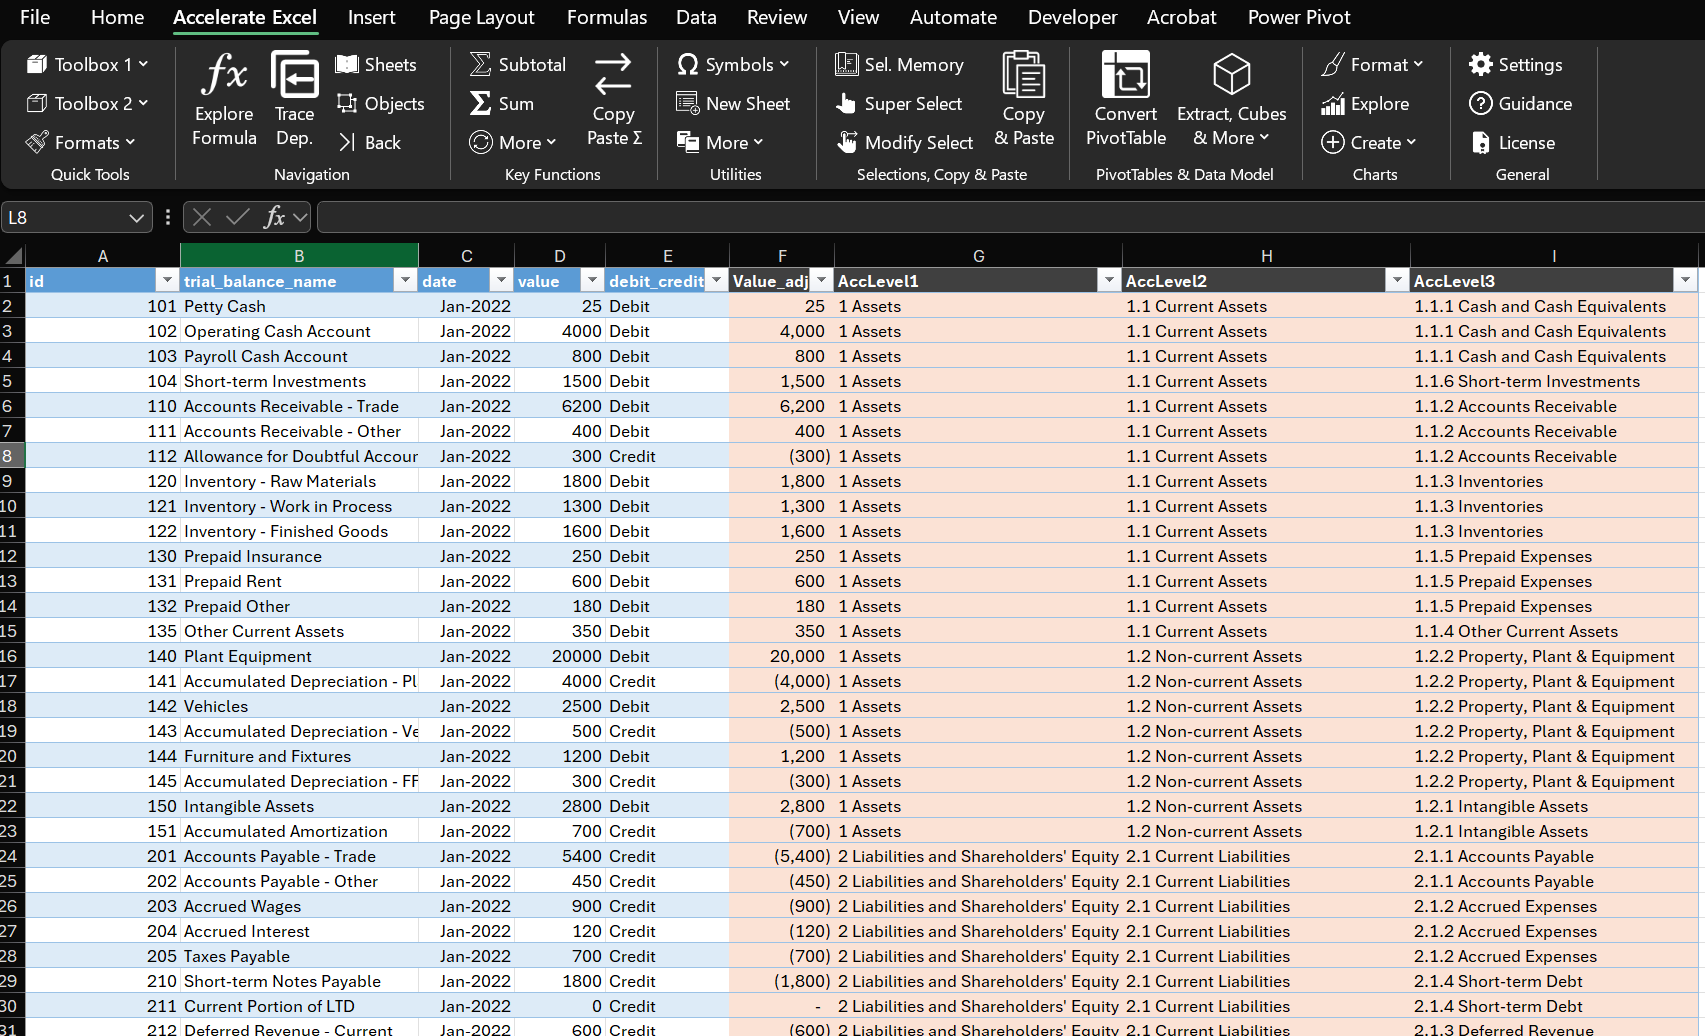
Exhibit 2. Source Data (enriched with account hierarchy information)
Step 2: Inserting the PivotTable
Select your prepared data.
Go to Insert > PivotTable.
Choose New Worksheet or specify a location within an existing sheet.
Step 3: Configuring the PivotTable
Excel displays a blank PivotTable and the Field List panel. Here's how to build your balance sheet:
Rows: Drag your hierarchy fields here (e.g., account category, account subcategory, account name)
Columns: Add time-based fields for comparison (date, month, quarter, year)
Values: Place your value/amount field here—Excel will sum by default
Filters (optional): Add entity, region, or department filters for quick segmentation
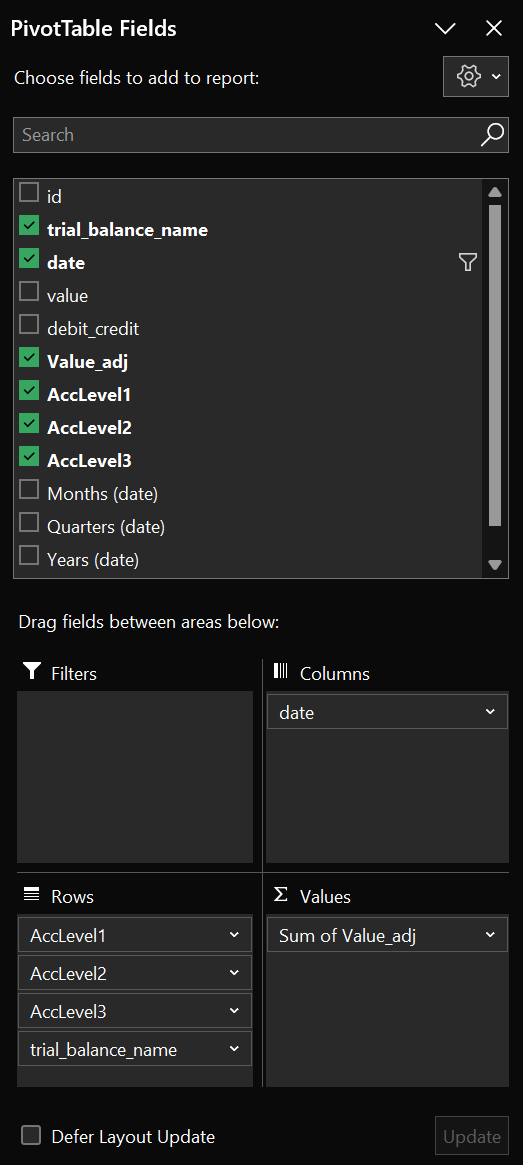
Exhibit 3. PivotTable Field List Configuration
Step 4: Enhancing and Formatting the PivotTable
Transform your raw PivotTable into a professional report:
Adjust Layout: Use the Design tab to switch between Compact, Tabular, or Outline formats
Add Subtotals: Enable subtotals at each hierarchy level via Design > Subtotals
Apply Number Formatting: Right-click values and select Number Format for consistency
Highlight Key Metrics: Use conditional formatting to flag variances or exceptions
Create Custom Style: Design > PivotTable Styles for consistent branding
Step 5: Adding Absolute and Relative Variance Columns (Optional)
Calculate period-over-period changes to reveal trends and anomalies:
Access Field List: Navigate to the PivotTable Fields panel on the right
Add Variance Fields: Drag Value_adj to the Values area twice more (three total instances)
Configure Absolute Variance: Left-click the second Value_adj item > Field Settings > Show Values As > select "Difference From"
Set Base Parameters: Choose Base field: Date, Base item: (Previous)
Configure Relative Variance: Right-click the third Value_adj item > Field Settings > Show Values As > select "% Difference From"
Apply Same Base Settings: Use Base field: Date, Base item: (Previous)
Rename Columns: Double-click each column header to assign descriptive names like "Absolute Variance" and "Relative Variance %"
Format Numbers: Left-click each variance column (in the PivotTables Fields panel) and navigate to Number Format to apply appropriate formatting
This creates dynamic variance calculations that automatically update when you refresh your data or modify the PivotTable structure.
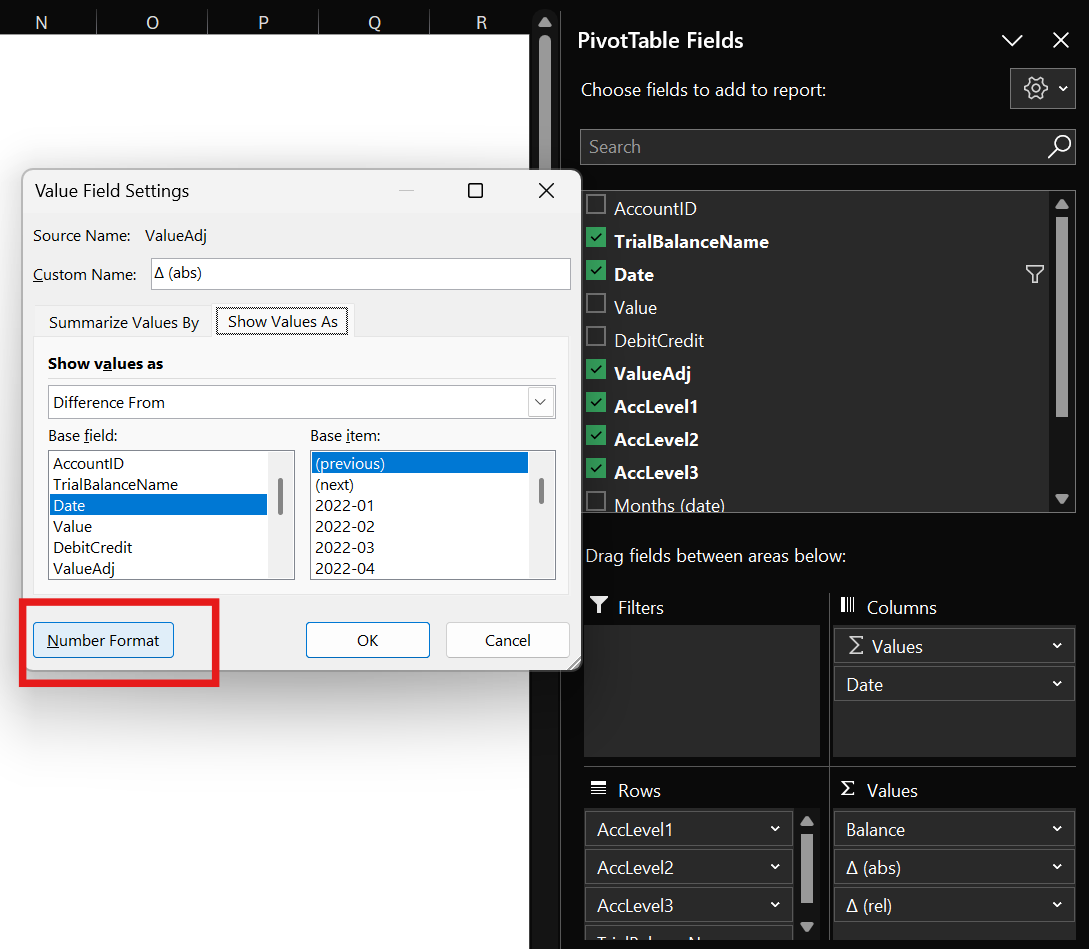
Exhibit 4. PivotTable Value Field Settings for Variance Columns
Tips and Tricks
Natural Sign Logic
Maintain accounting conventions throughout:
Assets = Positive values
Liabilities & Equity = Negative values
This approach enables straightforward summation and automatically validates that your balance sheet balances
Use PivotTables Built-in NumberFormat
Ensures consistent presentation
Avoids manual formatting
Simplifies readability and clarity
Create Custom PivotTable Styles
Develop your organization's standard PivotTable style:
Maintains brand consistency
Speeds up report creation
Ensures professional appearance across all financial reports
Use Calculated Fields Strategically
Reserve calculated fields for specific use cases:
Variance analysis (Actual vs. Budget comparisons)
Period-over-period growth calculations
Margin or ratio calculations
Keep core data simple—add complexity only when needed
Avoid Calculated Items
Calculated items (formula-created rows) add unnecessary complexity. With proper data hierarchy setup, you'll rarely need them. Leverage an appropriate source data structure to provide the flexibility you need.
More Tips and Tricks
Check out our comprehensive list of must-know PivotTable tips: Excel Pivot Tables: Tips for Finance Professionals.
Accelerate Excel & PivotTables
For professionals who build or audit complex Excel workbook using keyboard shortcuts and other time-saving utilities is a competitive advantage. Accelerate Excel, our specialized Excel add-in, has been made to streamline your Excel workflow. PivotTable-focused capabilities include:
Automatic Conversion of PivotTables to Regular Cells: For final distribution or complex formatting, you may need to convert your PivotTable to static cells. Our addin offers multiple conversion methods:
Hard-coded values for snapshots
SUMIFS formulas to link to the underlying source data
GETPIVOTDATA references to link to the initial PivotTable
Advanced cube formulas for more complex scenarios
Format PivotTable: Simultaneously apply standard PivotTable design properties. Ideal to apply the same settings quickly on multiple PivotTables.
Conclusion
Dynamic balance sheet PivotTables transform static reporting into powerful ad-hoc analytical tools. By investing time upfront in proper data structure and setup, you'll save hours every month while gaining deeper insights into your financial data.
The key is starting with well-structured source data and leveraging Excel's built-in PivotTable capabilities rather than over-engineering complex formulas.
Next Steps:
Download our sample files above and follow the step-by-step guide to build your first dynamic balance sheet PivotTable.
Looking for a more detailed walkthrough? Check out the guide on creating a P&L PivotTable, which uses the same principles as the balance sheet example.
Discover essential PivotTable features, advanced techniques, and common pitfalls here: Excel Pivot Tables: Tips for Finance Professionals.