How to Calculate CAGR in Excel
In M&A and financial due diligence, understanding how a business has grown over time is key to assessing its performance and valuation potential. The Compound Annual Growth Rate (CAGR) is a simple yet powerful metric that smooths out year-to-year fluctuations and highlights the underlying growth trend.
While essential in transaction analysis, CAGR is equally valuable in broader financial contexts such as corporate planning and investment analysis.
In this article, we’ll show you how to calculate CAGR in Excel and apply it effectively in your analysis.
What is Compound Annual Growth Rate (CAGR)?
CAGR, or Compound Annual Growth Rate, is a key financial metric used to measure the rate of return of an investment, revenue, EBITDA, or any other value over a specific number of years. It represents the smoothed annual growth rate, assuming that the value grows at a consistent rate each year and that growth is compounded annually
It answers the question: "If growth had been steady each year, what annual rate would take me from the starting value to the ending value over this period?"
This makes CAGR especially useful when actual growth varies from year to year, but you want a single number to describe the overall performance.
CAGR Example with cashflows:
If an investment grows from CHF 10,000 to CHF 16,105 over 5 years, the CAGR is 10%. That means it grew, on average, 10% per year — even if actual yearly growth varied. But if it were to grow by 10% each year, you would end up with:
Year 0: CHF 10,000
Year 1: CHF 11,000
Year 2: CHF 12,100
Year 3: CHF 13,310
Year 4: CHF 14,641
Year 5: CHF 16,105
CAGR Formula (Mathematical)
To calculate the Compound Annual Growth Rate (CAGR), use the following formula:

Mathematical CAGR formula highlighting final value divided by value of the investment raised to one over the total number of periods minus one to explain investment returns
If you were to enter this in Microsoft Excel, it would look something like this:
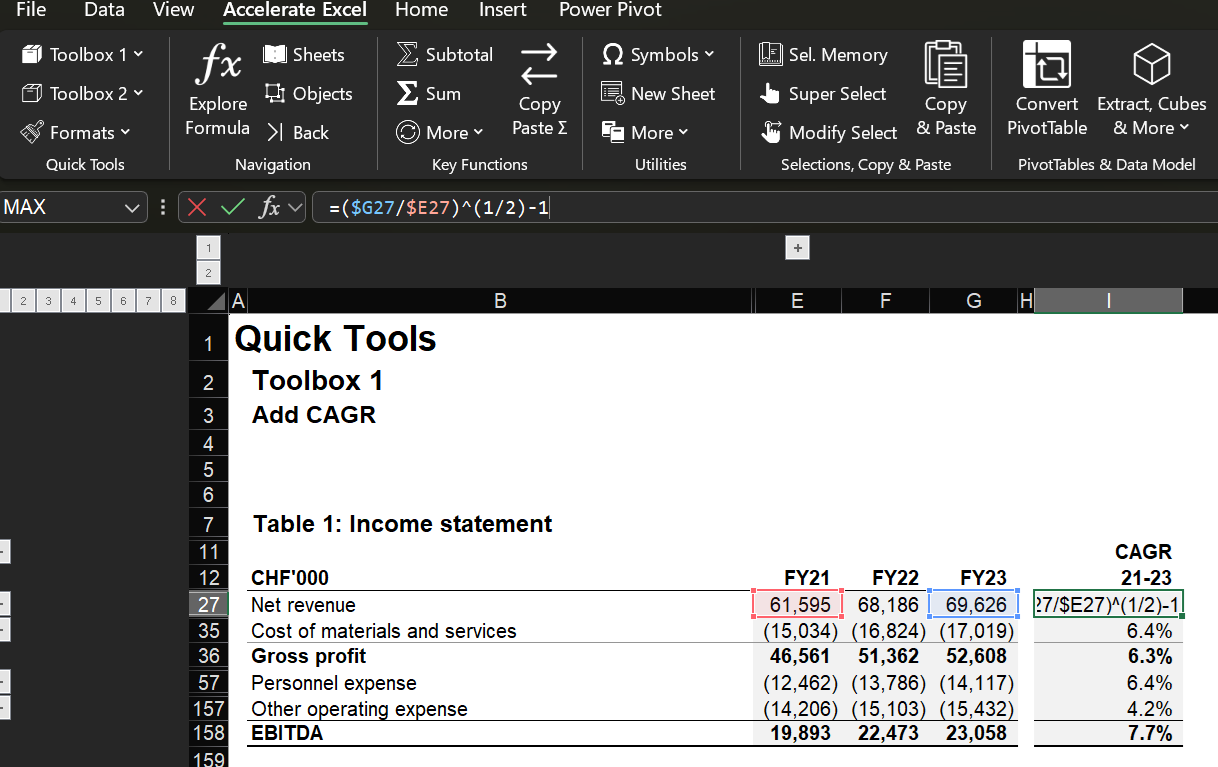
Excel formula template for manual CAGR calculation showing the compound annual growth rate inside native Excel cells
G27 = Ending Value (Net revenue in FY23)
E27 = Beginning Value (Net revenue in FY21)
Why Use Accelerate Excel to Calculate CAGR?
Using Accelerate Excel, offers several key advantages when calculating Compound Annual Growth Rate (CAGR):
Faster: Instantly calculate CAGR across large datasets without manually entering formulas
Accuracy: Eliminate formula mistakes and ensure consistent results in your financial analysis
Built-in shortcuts: Use intuitive tools that simplify your Excel tasks and speed up repetitive work
CAGR keyboard shortcut: Select two cells using 'CTRL', hit the ribbon button or Alt > G > 1 > G, enter the number of years, enter a threshold value and the output cell, and the add-in inserts a CAGR function.
Custom threshold: Set upper/lower limits (e.g., 100%) to make the output more readable.
CAGR in Excel made easy watch this quick GIF to see an efficient one-click tool calculate CAGR step-by-step
Different Ways to Calculate CAGR
When performing financial analysis or forecasting future performance, calculating the Compound Annual Growth Rate (CAGR) is a fundamental step. While Excel does not offer a dedicated CAGR function, there are several reliable methods to calculate it based on your data and use case.
1. Manual CAGR Formula (Most Flexible)
If you know the initial value, the future value, and the number of years, you can use the standard CAGR formula manually in Excel:
Beginning Value is in
A2Ending Value in
B2Years in
C2
Format the result as a percentage to express the interest rate or rate of return.
This approach is the most transparent and useful for custom financial models and dashboards.
2. Using the RRI Function (Compact and Accurate)
Excel provides the RRI function, which returns the equivalent interest rate for the growth of an investment over time:
nper= number of yearspv= initial value (present value)fv= future value
This is helpful for quick forecasting scenarios when modelling investment or business growth over a set time period.
3. Using the RATE Function (When Payments Are Involved)
The RATE function is typically used for loans or investments with regular payments, but it also works for CAGR if you set the payment to zero:
nper: The total number of payment periods (e.g., months, years).
pmt: The payment made each period.
pv: The present value or initial investment. 7030A0
[fv]: The future value (optional, defaults to 0 if omitted).
[type]: Specifies whether payments are made at the beginning (1) or end (0 or omitted) of the period.
[guess]: An optional initial guess for the interest rate (helps with iterative calculations, can speed up the process
For calculating the CAGR, you need to set:
nper = 5 (number of years)
pmt = 0 (payments made)
pv = Beginning Value (entered as negative)
[fv] = Ending Value
Note: the beginning value (pv) is entered as a negative number, and the ending value (fv) as positive.
This function is beneficial when extending financial analysis to more complex cash flow scenarios.
4. Using LOG Functions (Alternative for Manual Calculation)
Another method to calculate CAGR uses logarithms, which is useful in certain analytical contexts or if you're automating calculations across a dataset:
fv: Ending Value
pv: The present value or initial investment.
nper: The total number of payment periods (e.g., months, years).
This method produces the same result as the manual CAGR formula and is mathematically equivalent.
Common Mistakes to Avoid
Wrong time units: Make sure your time periods match (e.g. don't mix months with years).
Negative or zero values: These will break the CAGR formula or return errors.
Non-compounded growth: CAGR assumes growth is compounded. If it’s not, consider using AAGR (Average Annual Growth Rate) instead.
CAGR is great for smoothing out volatility, but it hides year-by-year fluctuations. If you want to show actual yearly performance, consider using a chart with annual growth rates alongside CAGR.
Conclusion
Although Excel does not have a built-in CAGR function, there are several reliable methods to calculate it depending on the situation. These approaches support accurate calculations whether you are evaluating investment performance, conducting forecasting, or performing business and data analysis. Each method transforms your inputs into a meaningful interest rate that reflects the average annual growth over a defined period of time. By using the initial value, future value, and the number of years between them, you can clearly understand the growth of your initial investment.